You have landed on this page after seeing a snapshot of emissions, similar to the example below, on your media plan. This page aims to explain the methodology behind the numbers shared and the factors to consider when using them.
The emissions estimate is powered by our partnership with Scope3. It only includes the digital portion of your campaign, for now.
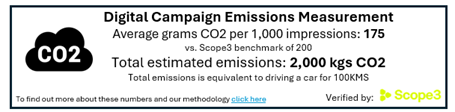
Grams of CO2 per 1,000 impressions
Average grams of CO2 per 1,000 impressions (gCO2PM) is a measure of emissions efficiency used by Scope3 to enable comparisons across channels and vendors. Each JCDecaux asset has an individual score based on the power draw and impressions of that asset. This score shows the median gCO2PM score for your campaign. We use median to align with the Scope3 digital Out-of-Home benchmark.
This score and the Scope3 methodology use a location based approach. On top of this, JCDecaux covers 100% of our asset (and operational) electricity consumption with renewable sources (either direct Green Power or Australian Renewable Energy Certificates). JCDecaux’s Scope 2 emissions on a market based approach are zero.
Interventions that could affect the gCO2PM score include:
Daily power draw of the screen
Energy efficiency of the asset screen – JCDecaux aims to ensure all upgraded or new screens have the latest energy efficiency interventions.
State where the asset is located – some states have a lower emissions grid mix than others (i.e. more renewable energy online).
For programmatic campaigns, the time of day will affect the emissions as certain times of day have higher renewables in the grid mix.
The size of the screen – larger screens draw more power.
Impressions of the assets
Assets with higher impressions will have a lower score, all else being equal.
For programmatic campaigns impressions are recorded per hour of the day, so time of the campaign will affect the impressions and therefore the score.

Total Estimated Emissions
Total estimated emissions is calculated using the gCO2PM and the total impressions for each asset for your campaign.
To try and bring this figure to life, we have compared the total campaign emissions to the distance you could travel with the medium sized petrol car. For this comparison we have used a standard petrol per km and emissions factor that can be found at this link.
Methodology and considerations
This data is modelled on a representative day from the previous quarter. To enable comparative reporting, this same day should be used for post-campaign reporting.
JCDecaux asset, power draw, and impressions data is updated on a quarterly basis. It may be that when you receive emissions reporting a small number of assets your campaign will run on are not included in the current data set and so are excluded from the emissions estimate.
Click here to find out more about the Scope3 methodology and what is included.
Find out more about JCDecaux’s wider sustainability efforts and performance in our latest sustainability report.